Data Science with Knime
0 - Introduction
You are reading a short article explaining an introductory data science workflow using Knime. In this workflow we are using a Random Forest Model to determine survivorship with Titanic passenger data. Here is the Knime about screen. Note the version number. If you are using a different version of Knime then your screens may not exactly match what is shown here.

The data and the Knime workflow are part of the repository [found here]so you won't have to search for it on Kaggle. The workflow is shown below with each of the nodes in the workflow labeled with a number corresponding to the numbered sections below. The Titanic problem is a classification problem. Classify passengers as survivors or, well... This simplifies our selection of a modeling algorithm. Here we will use a random forest because it works well for problems of this nature and it is fairly robust to overfitting. Now we could use Support Vector Machines, KNN, K-Means, Naive Bayes or some boosted algorithms but here we believe Random Forest will work quite well. And since our data isn't too voluminous we are not worried about one of the weaknesses of this model, performance.

Enjoy!
1 - CSV Reader
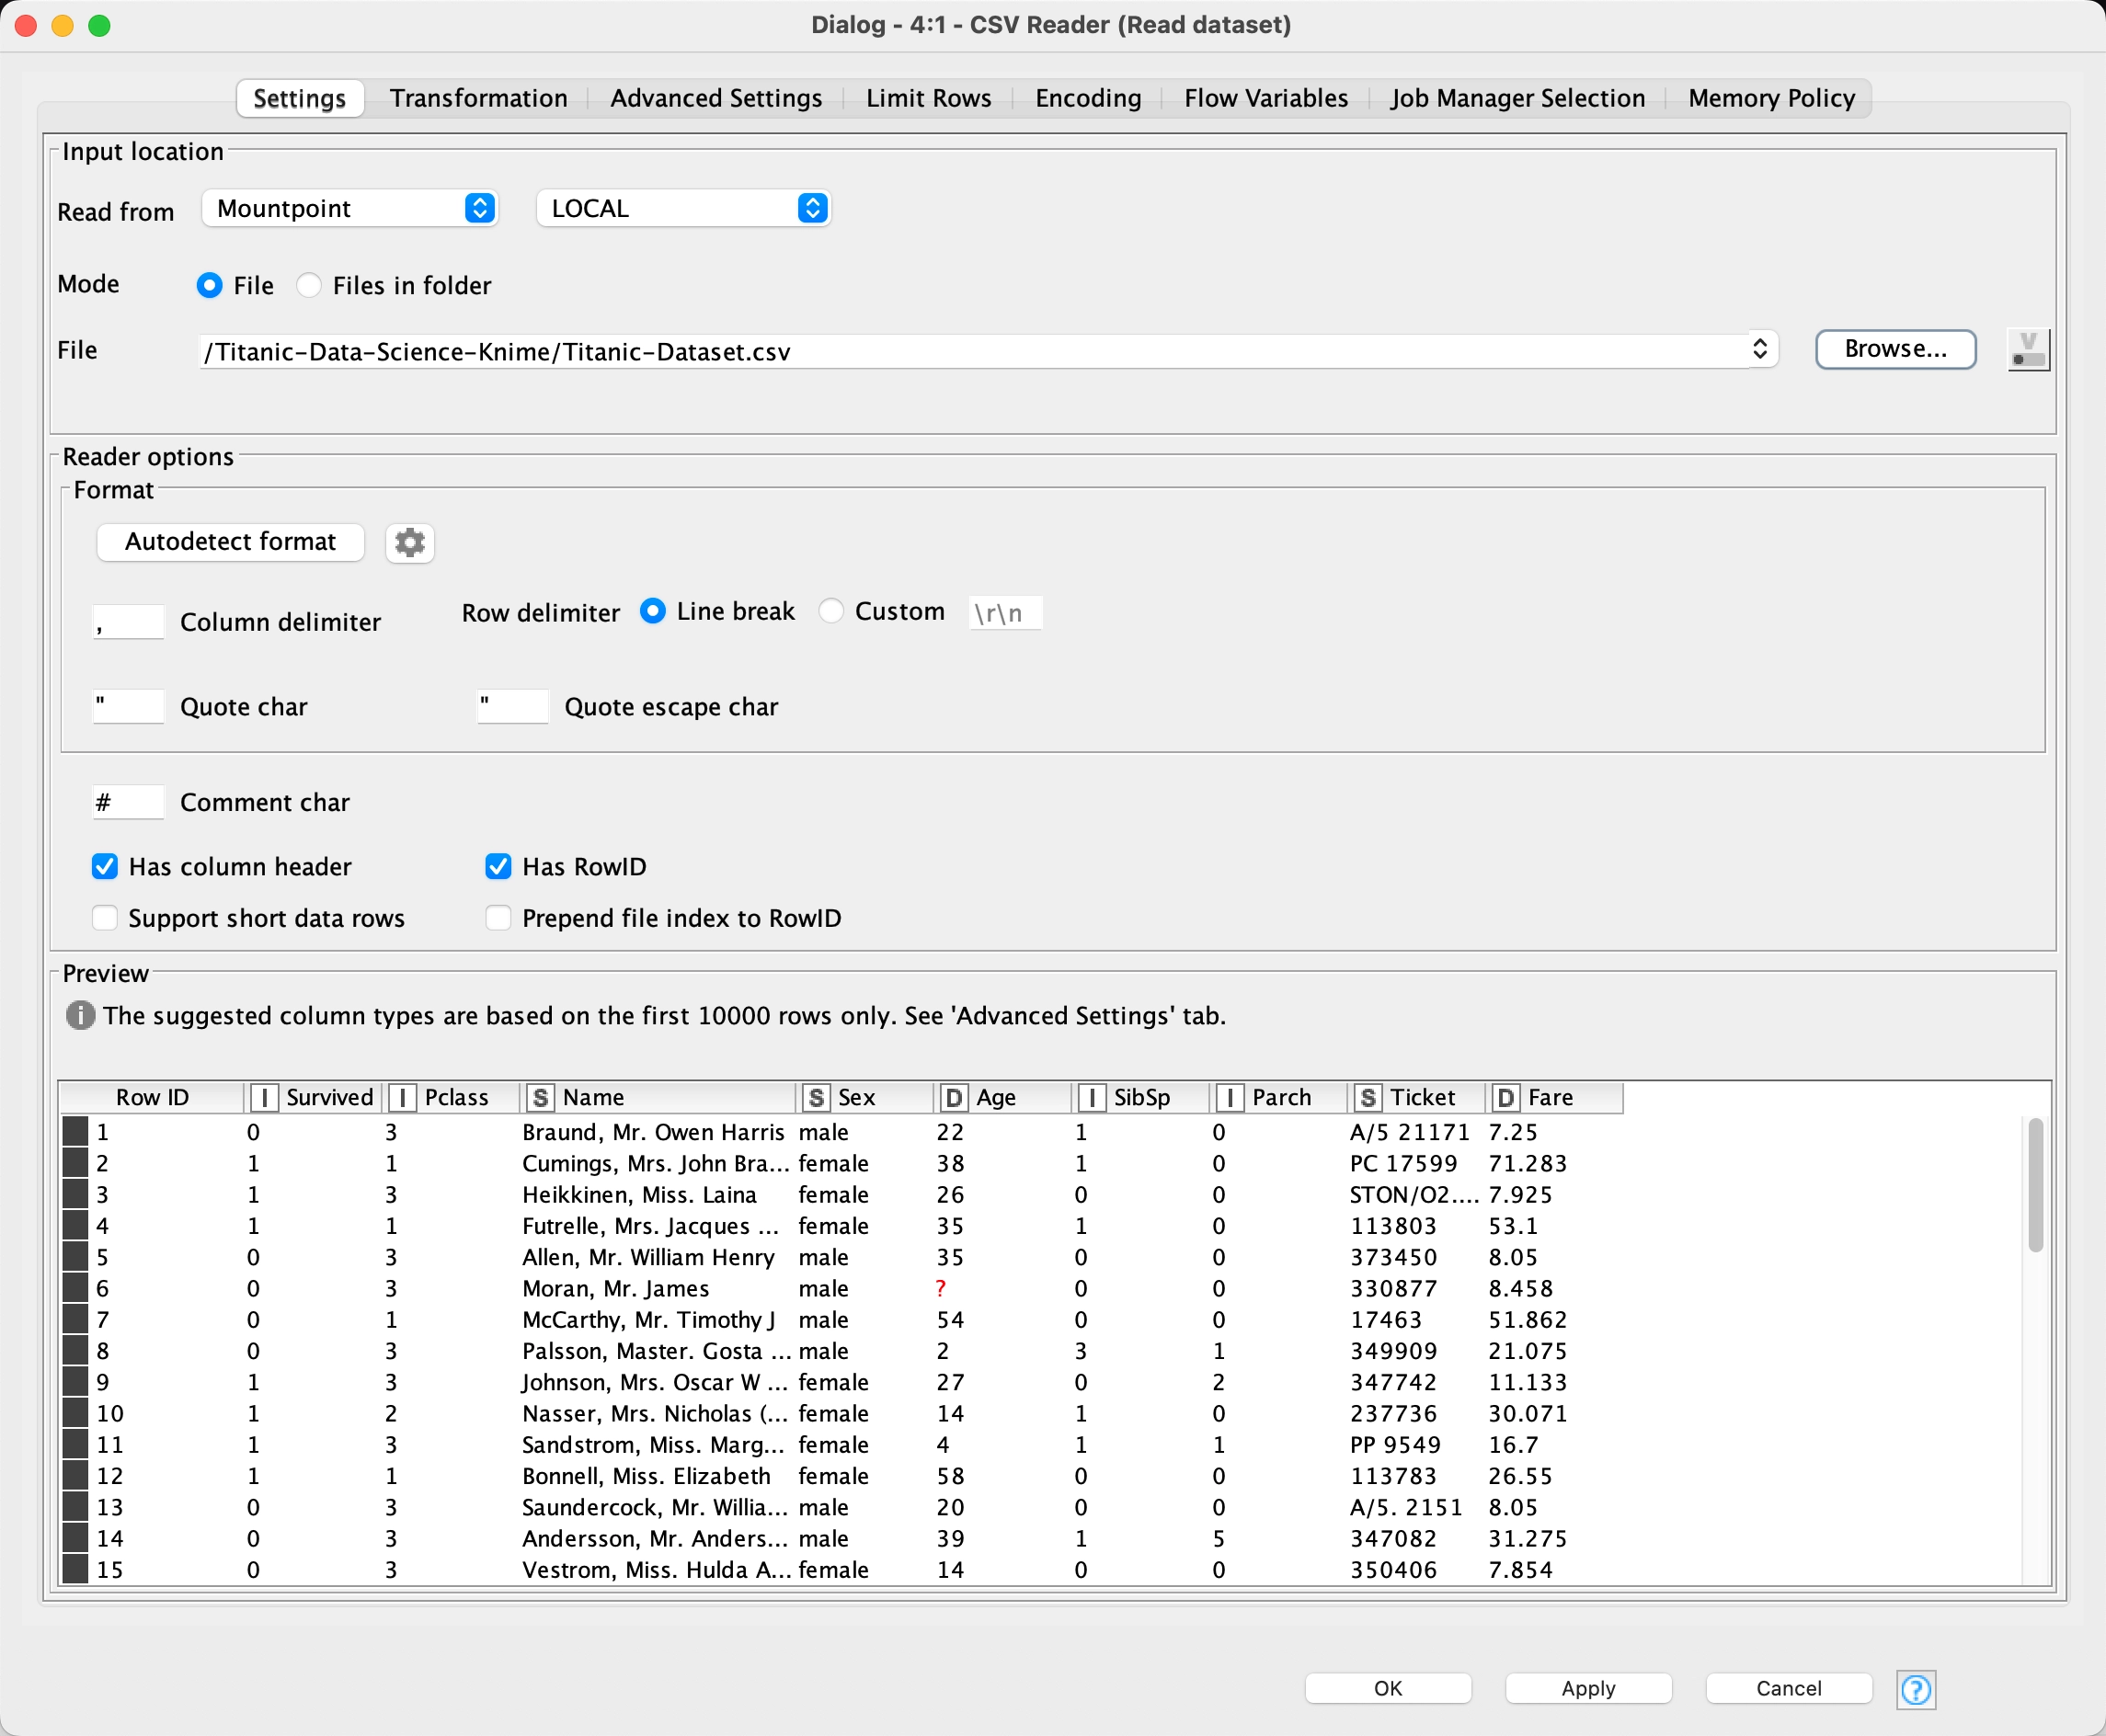
This Knime component reads in the passenger data from the file: Titanic-Dataset.csv which was obtained from Kaggle. No transformations were performed.
2 - Statistics View
We always profile the data and see things like missing data which we will fix as well as identify what attributes are important for the model and which ones probably won't help. Here we see a statistical analysis of the Titanic dataset using the Statistics Knime node. The number of missing age values is highlighted.
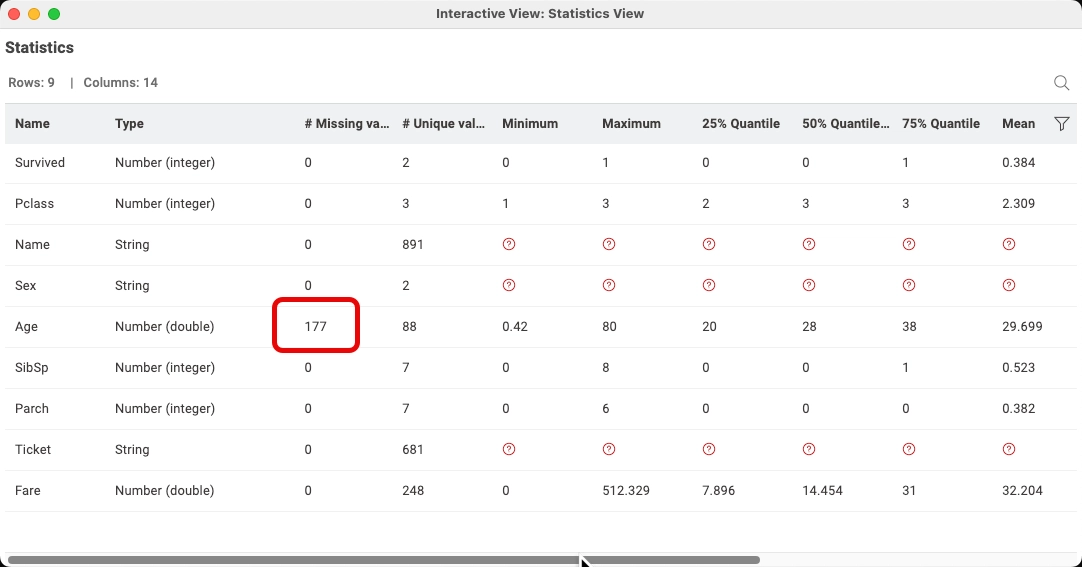
Most of the attributes look okay except we have 177 missing values for the age field. We will fix that a little later on by simply replacing the missing values with the average age. Some of you may have a philosophical difference of opinion and believe that is too simple or we should not include the missing values in our analysis. Here I'm just showing one way to do the analysis.
3 - Missing Value
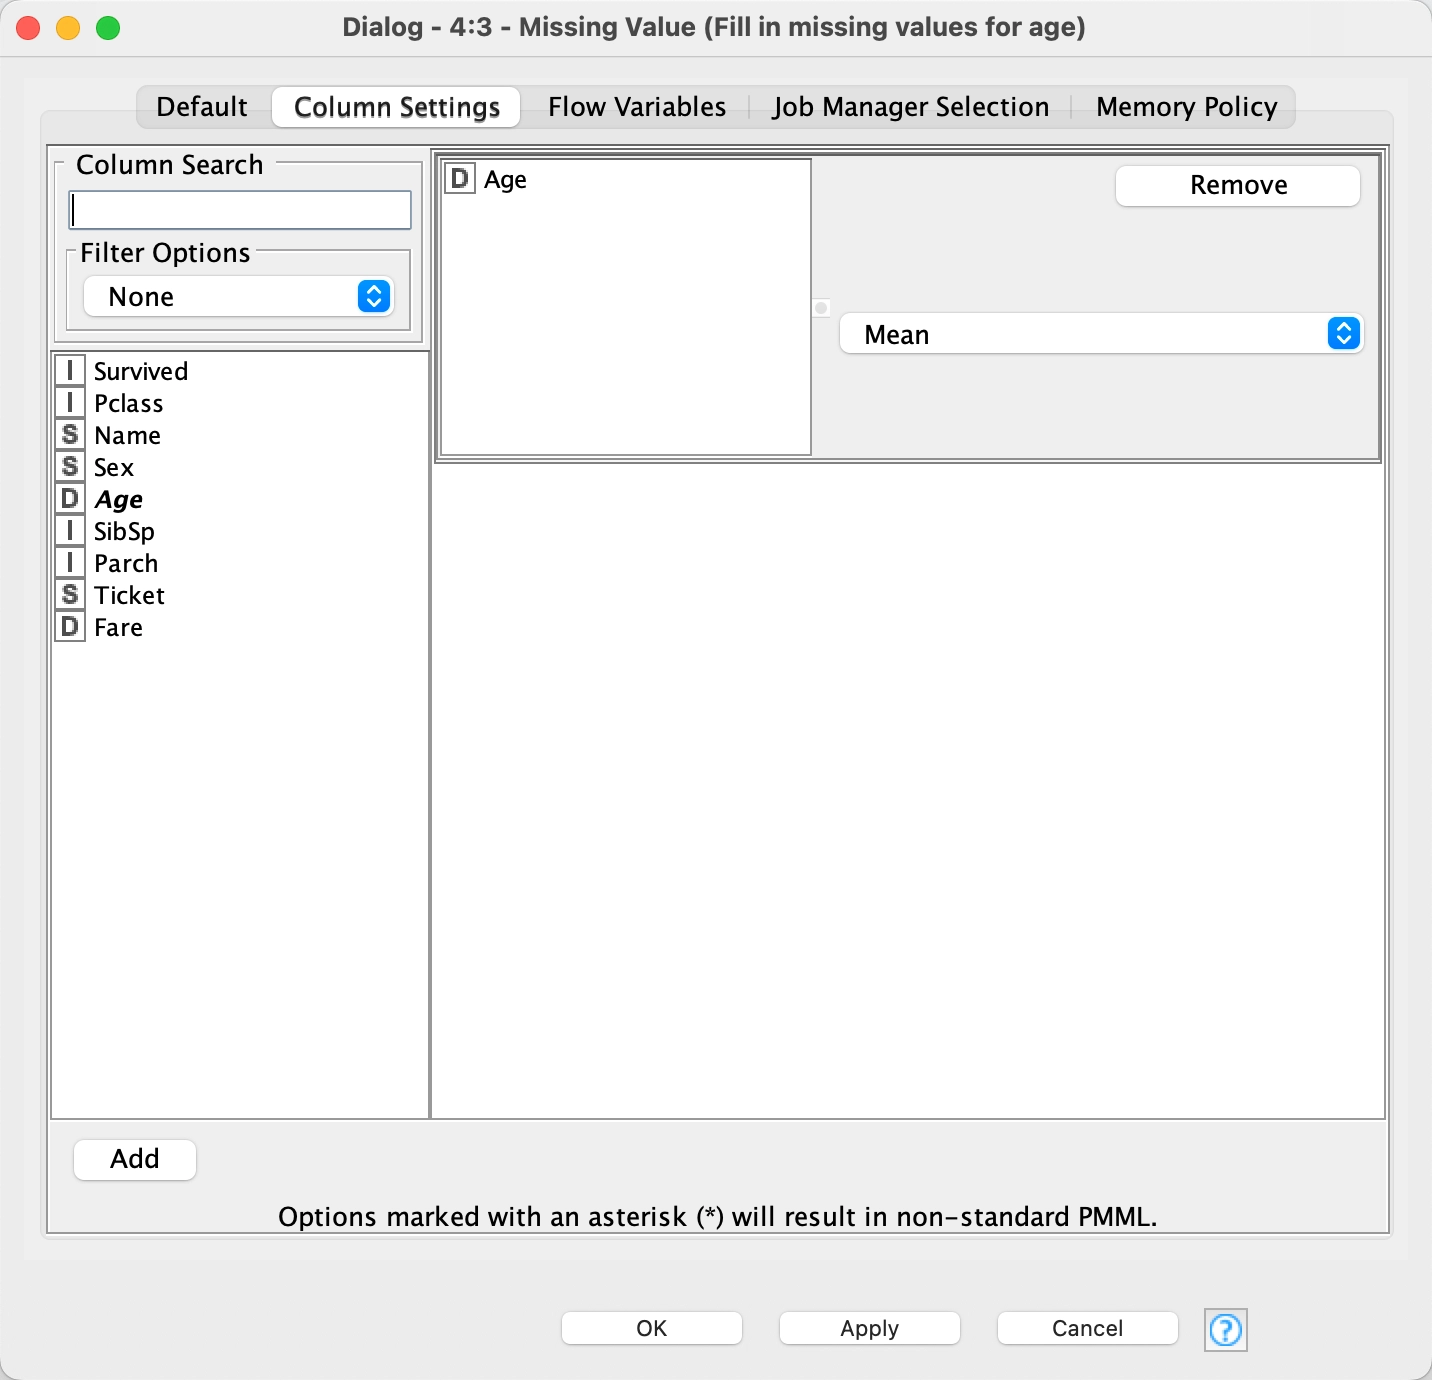
Let's fix the missing age values by replacing them with the mean age. To do this we use the Missing Value node, configure it for the Age field and set it up as seen below in this oversized image. 8)
4 - String Manipulation
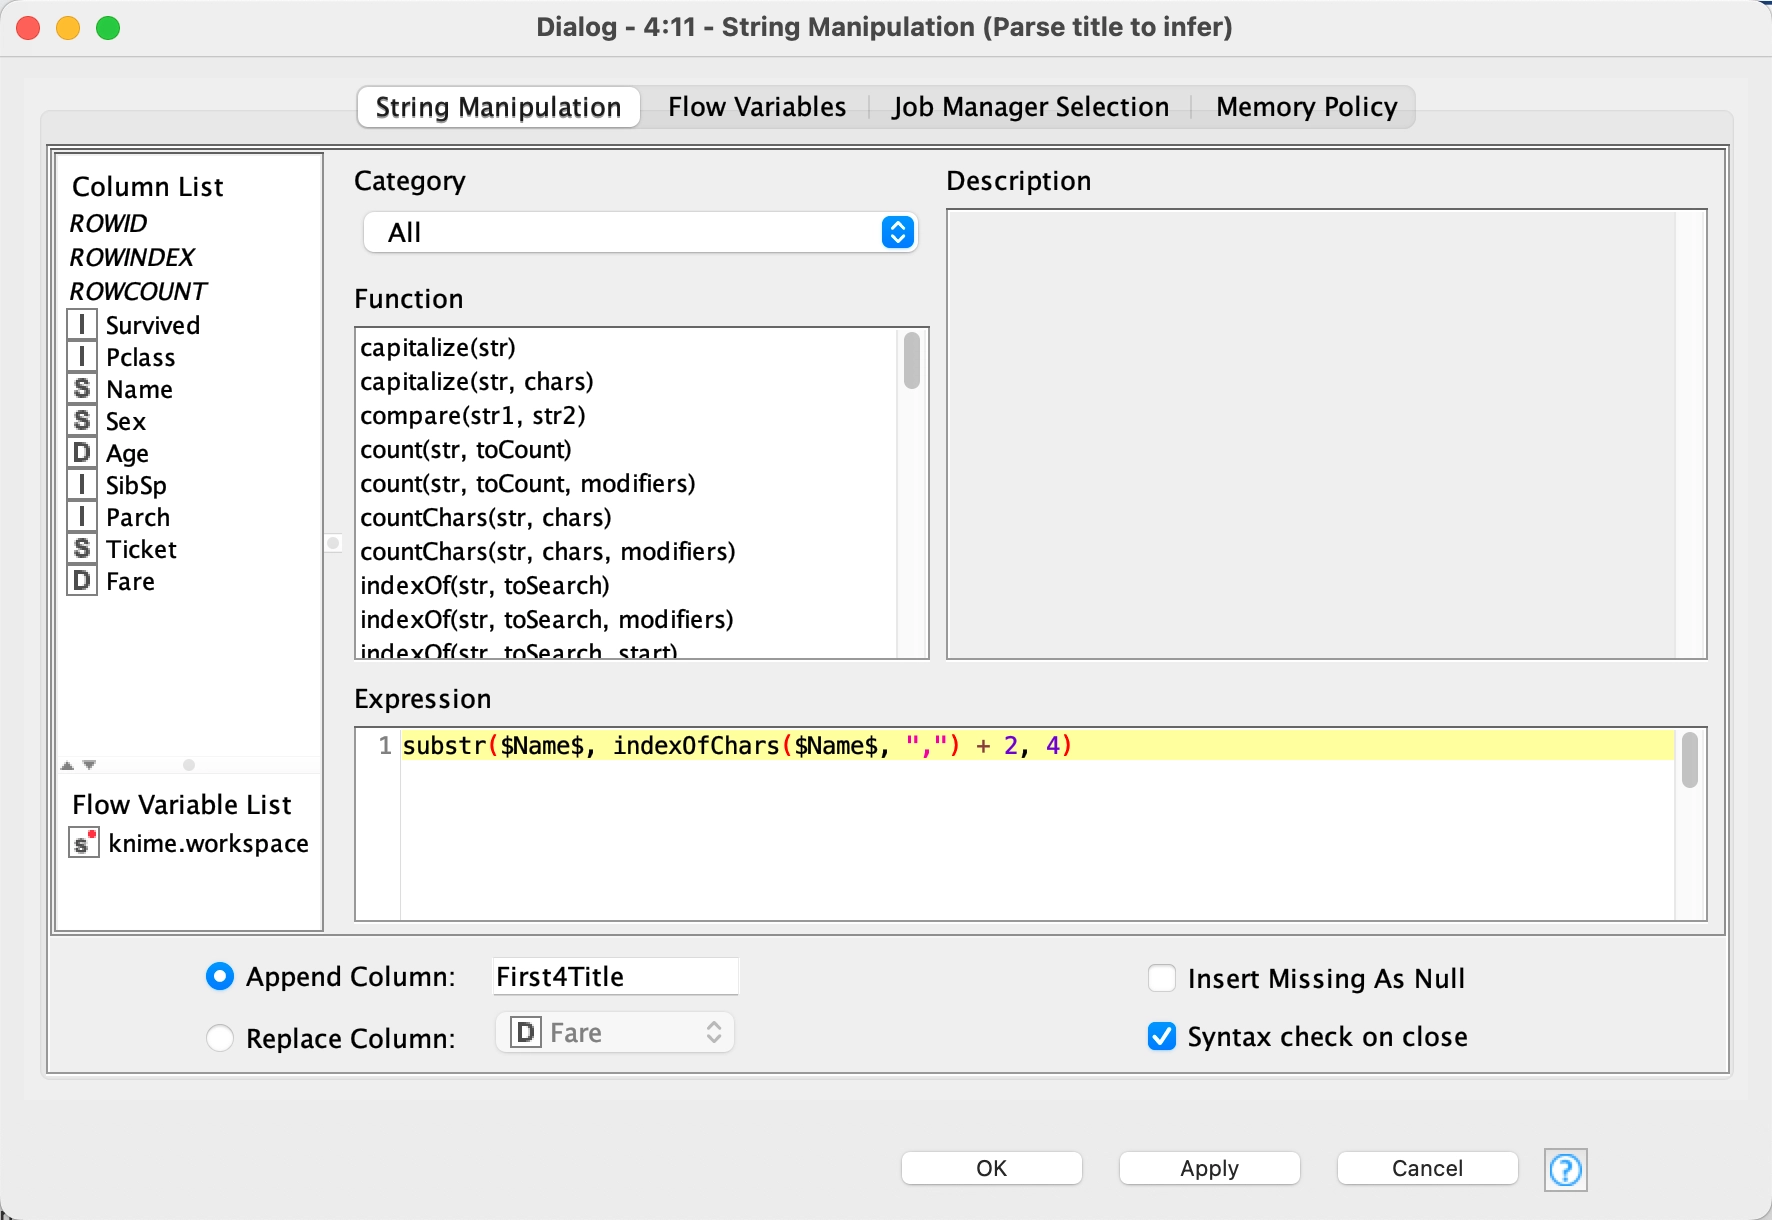
Here we begin manipulating the strings to further classify our data, in this case, we are parsing the title which are the first four characters after the first comma of the Name field. The title values are 'Mr. ','Dr. ', 'Mrs.', 'Miss' and 'Mast'. We see that The Rule Engine node while powerful takes some getting used to. The $Name$ is how you select the variable. The indexOfChars returns the index of the string, then we move over two characters and then copy the next four characters out of the $Name$ field. After running this node, the field, First4Title has the title values.
5 - Rule Engine
In this Rule Engine node we are classifying each person as an adult or a child using the variable $First4Title$ we created in the previous step: ("Mrs.", "Mr. ", "Dr. ") =< "Adult" and ("Miss", "Mast") =< "Child"
I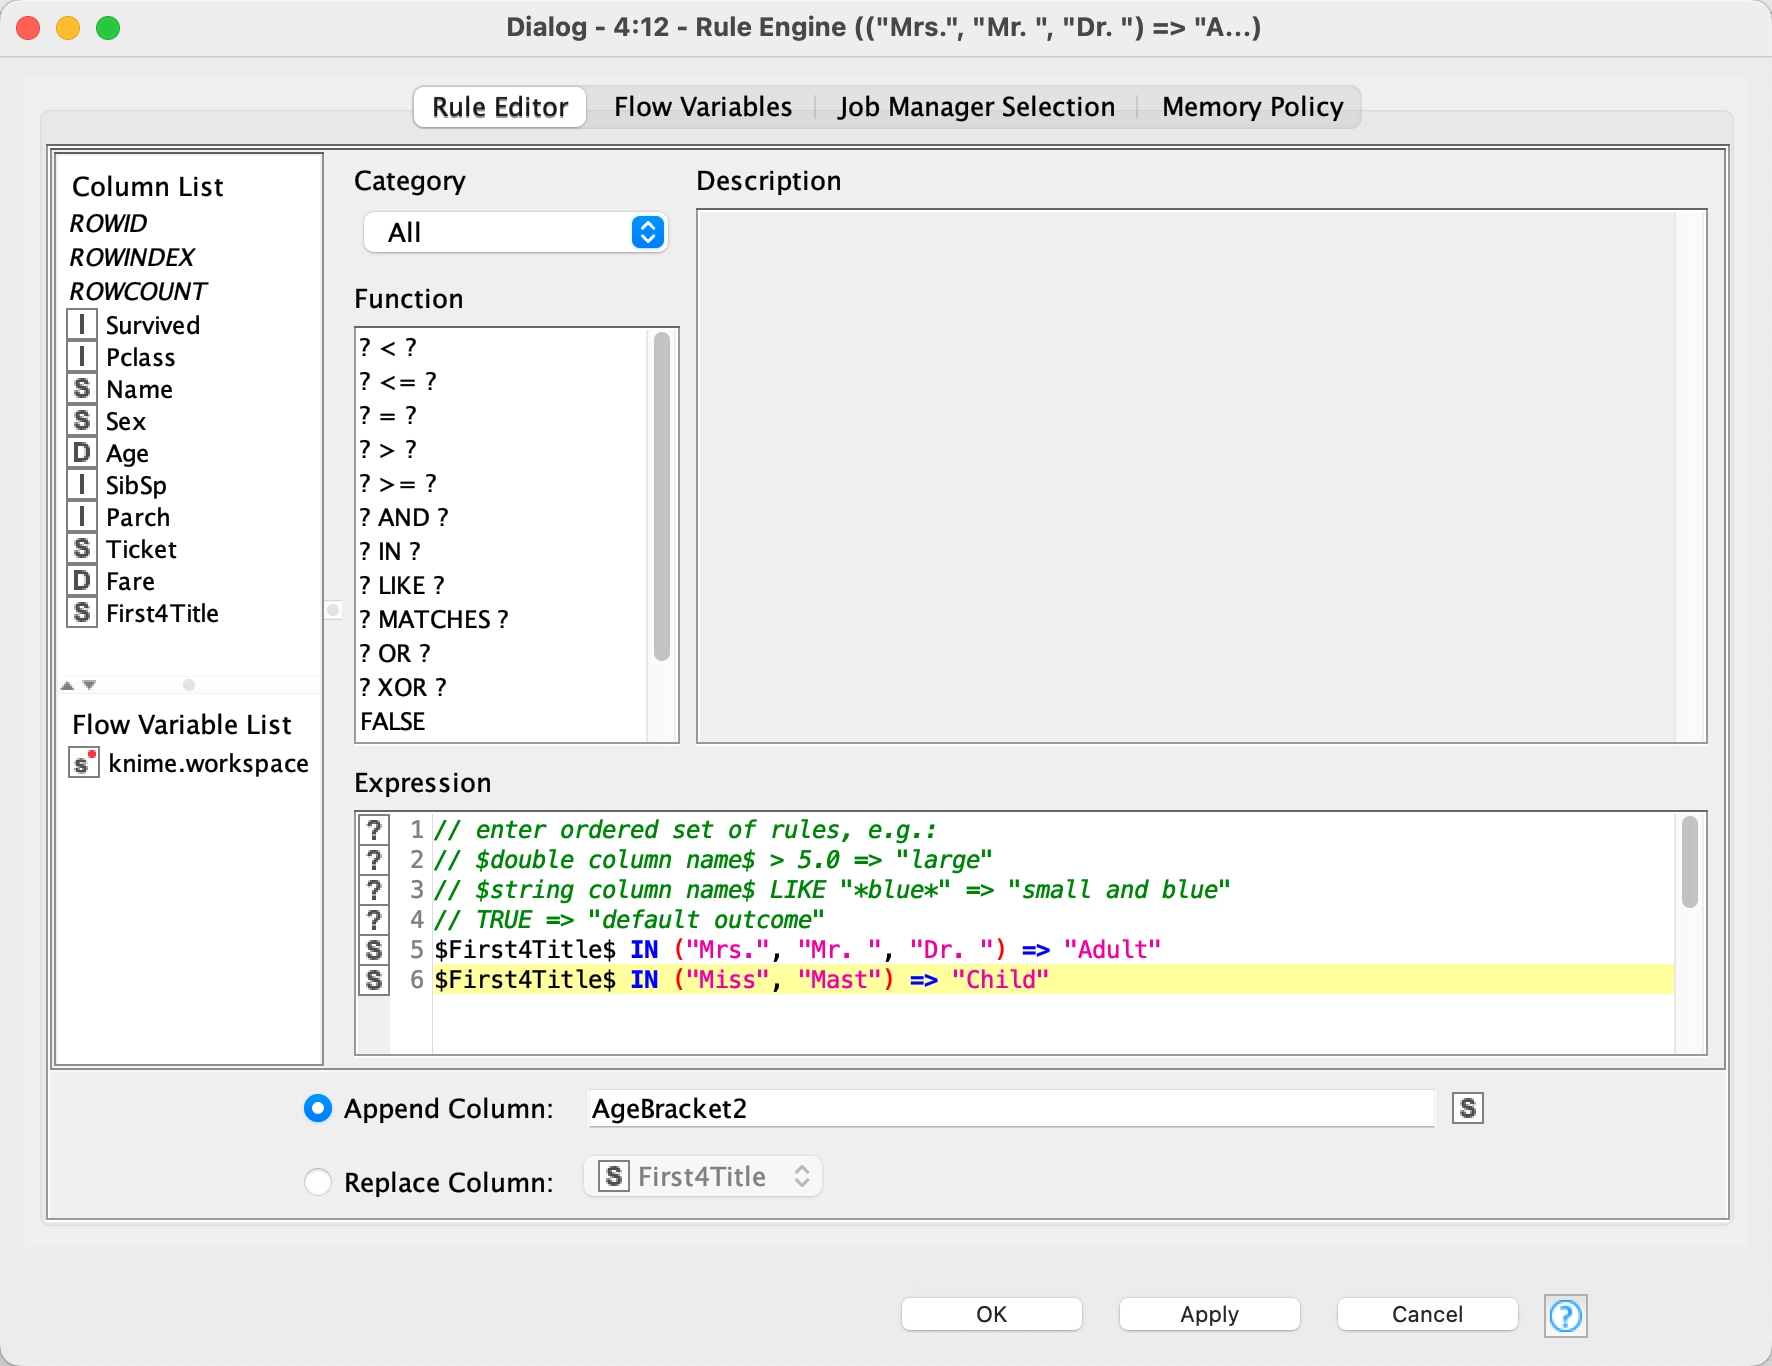
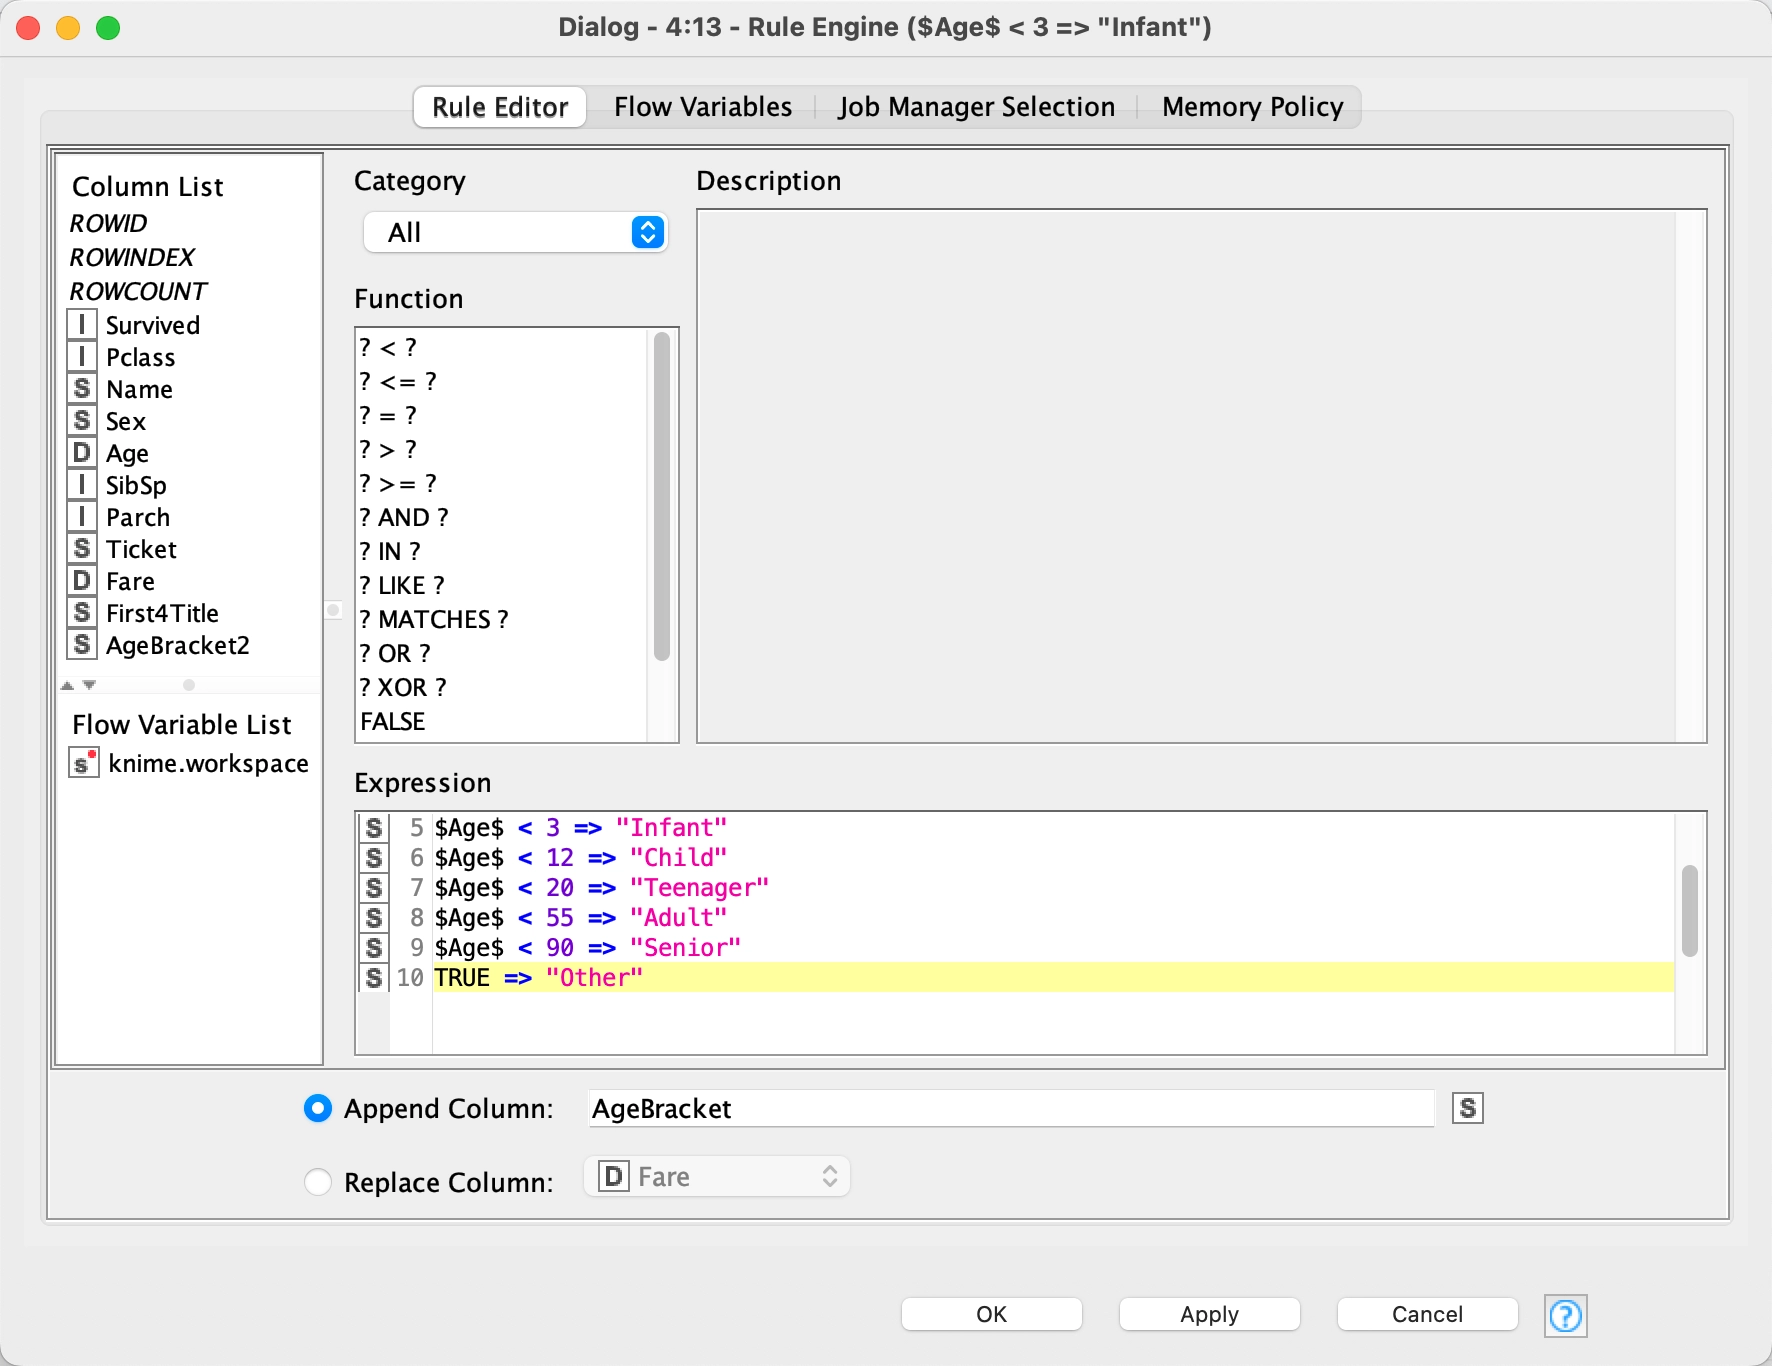
6 - Rule Engine
In this Rule Engine node we are classifying each person into a new variable, $AgeBracket$, based upon their age using the variable $Age$:
    $Age$ < 3 => "Infant"
    $Age$ < 12 => "Child"
    $Age$ < 20 => "Teenager"
    $Age$ < 55 => "Adult"
    $Age$ < 90 => "Senior"
7 - Rule Engine
The reason for the preceeding two nodes was to create $AgeBracket$ and $AgeBracket2$ columns and fill in any missing values of $AgeBracket$ with $AgeBracket2$. We accomplish this with the Rule Engine node and the following code:
        MISSING $AgeBracket$ => $AgeBracket2$
        TRUE => $AgeBracket$
which copies the value of $AgeBracket2$ into $AgeBracket$ if $AgeBracket$ has no value.

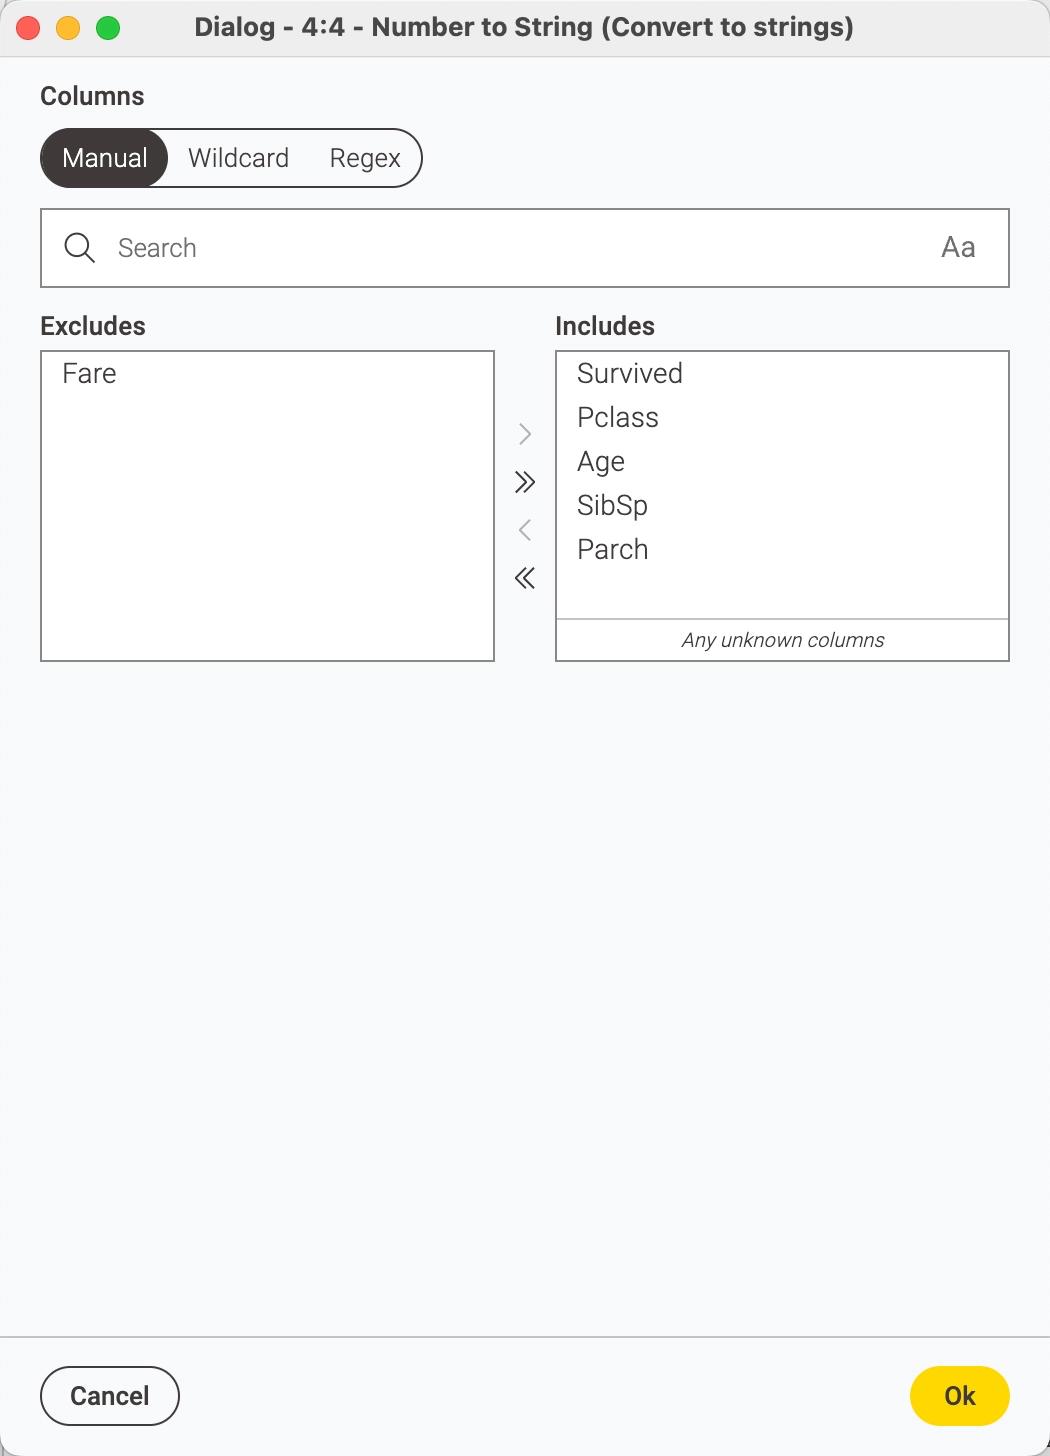
8 - Number to String
Now we need to classify our Number variables to String variables as this is important for our model to work well. It needs categorical or ordinal or classifier variables so we use the Number to String node:
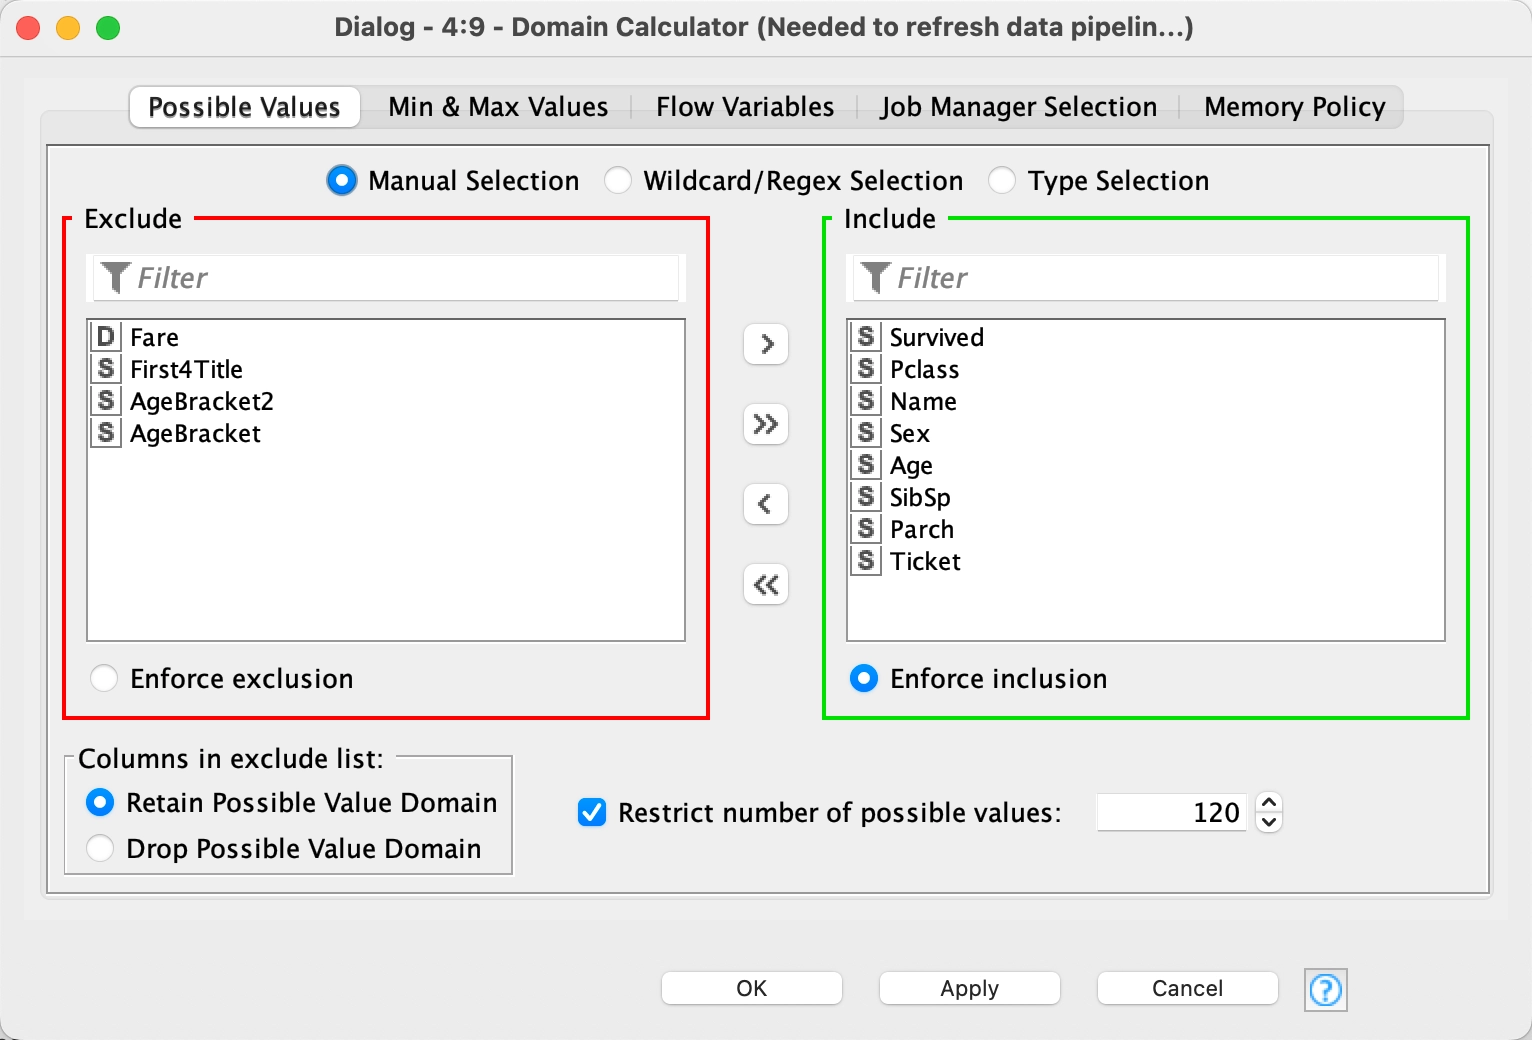
9 - Domain Calculator
The Domain Calculator scans the data and updates the possible values list and/or the min- and max values of selected columns. This node is useful when the domain information of the data has changed and must be updated in the table specification, for instance, the domain information as contained in a table spec may be void when a row filtering (e.g. outlier removal) is carried out so it is necessary to run this node to "reset".
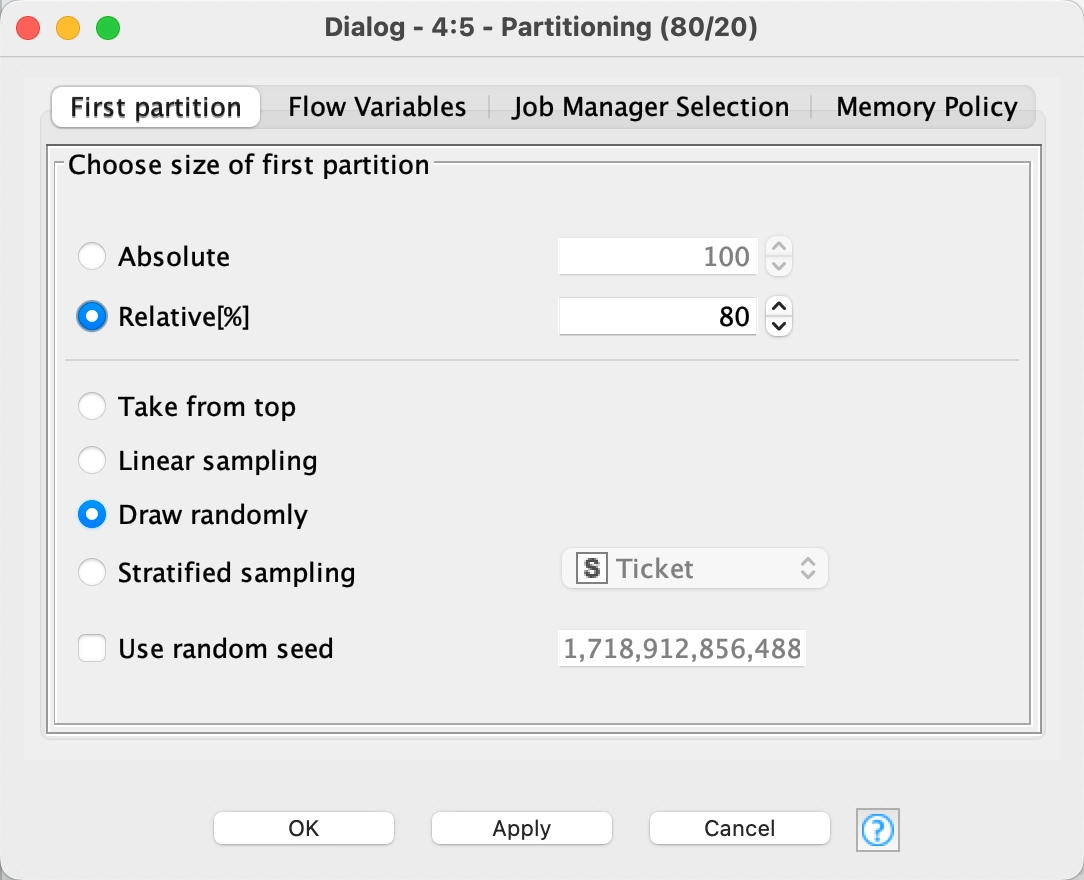
10 - Partitioning
We partition the dataset 80/20 using the Partitioning node. This means 80% of our data will train the model and the other 20% will be our testing data.
11 - Random Forest Learner
A decision tree model makes a decision based upon branches from numerous input variables and use these to produce groupings of outcomes. Each result or outcome will fit into one of those groupings. When the model entertains a record it has not already sorted, such as one we are asking it to make a prediction for, it finds which grouping it fits into best by going through the decision tree criteria, and where it ends up is the prediction. Cool, huh?

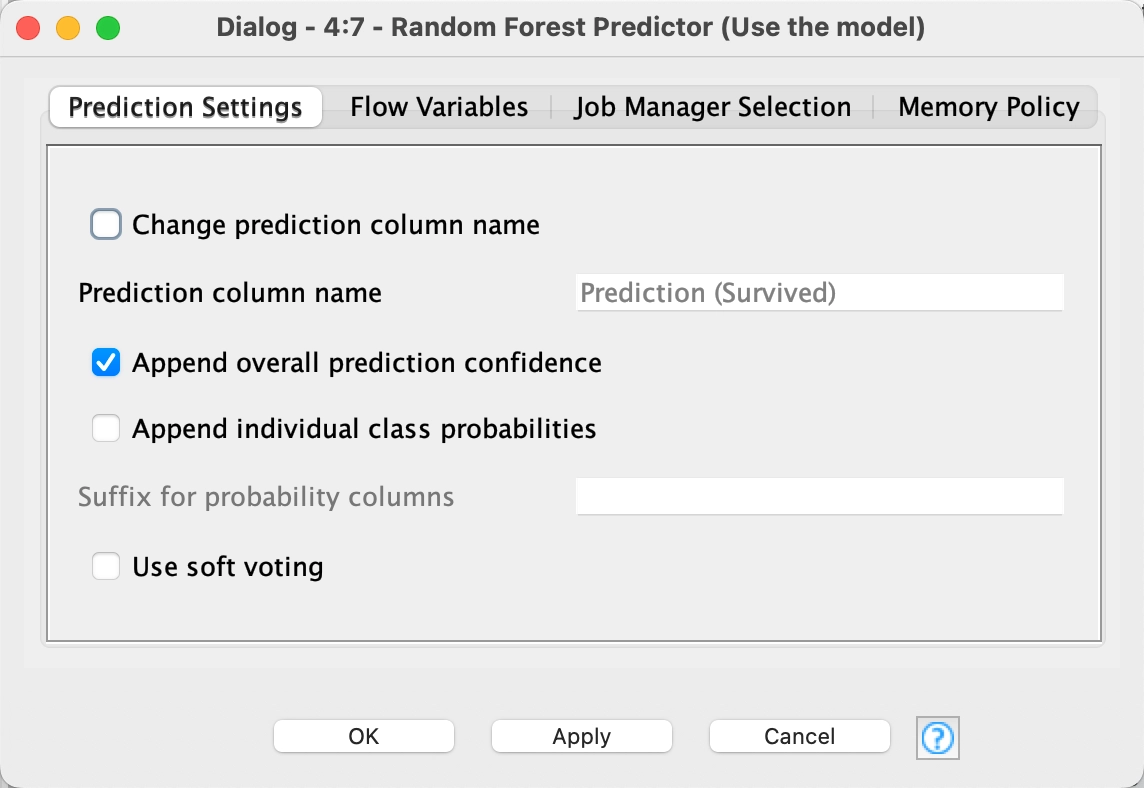
12 - Random Forest Predictor
The Random Forest Predictor node predicts patterns according to an aggregation of the predictions of the individual trees in a random forest model. It takes the model we created in the Random Forest Learner node and applies it to the test data.
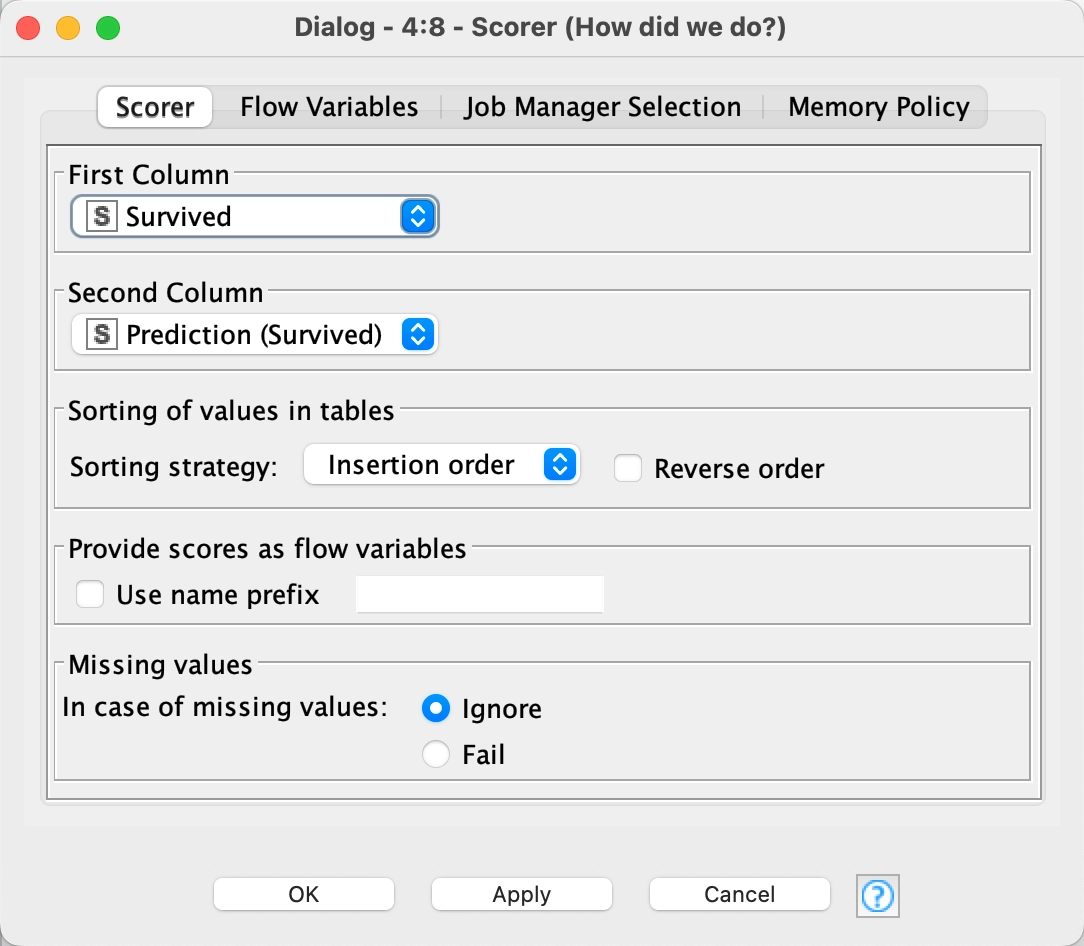
13 - Scorer
How do we know actually how we did? We use the Scorer node. The Scorer node compares two columns, in this case, Survived and Prediction (Survived), by their attribute value pairs and shows the confusion matrix, i.e. how many rows of which attribute and their classification match. The dialog allows you to select two columns for comparison; the values from the first selected column are represented in the confusion matrix's rows and the values from the second column by the confusion matrix's columns. The output of the node is the confusion matrix with the number of matches in each cell. Additionally, the second out-port reports a number of accuracy statistics such as True-Positives, False-Positives, True-Negatives, False-Negatives, Recall, Precision, Sensitivity, Specificity, F-measure, as well as the overall accuracy and Cohen's kappa .
We hope you have enjoyed this quick tour of one of the ways of predicting survivorship of the Titanic passengers.